What’s New with Camms.Insights
You may have already noticed we’ve added some features to the Camms.Insights interface to make it more user-friendly, modern and look much cooler. We’ve also made some changes when creating a new report as well. Here’s some highlights of the updates.
1. You Can Now View Selected Data Sources in Its Own Section
When selecting the data sources you want, you’ll see a dedicated area which displays all the data sources you have added, so you don’t have to endlessly scroll through the entire list to find them.
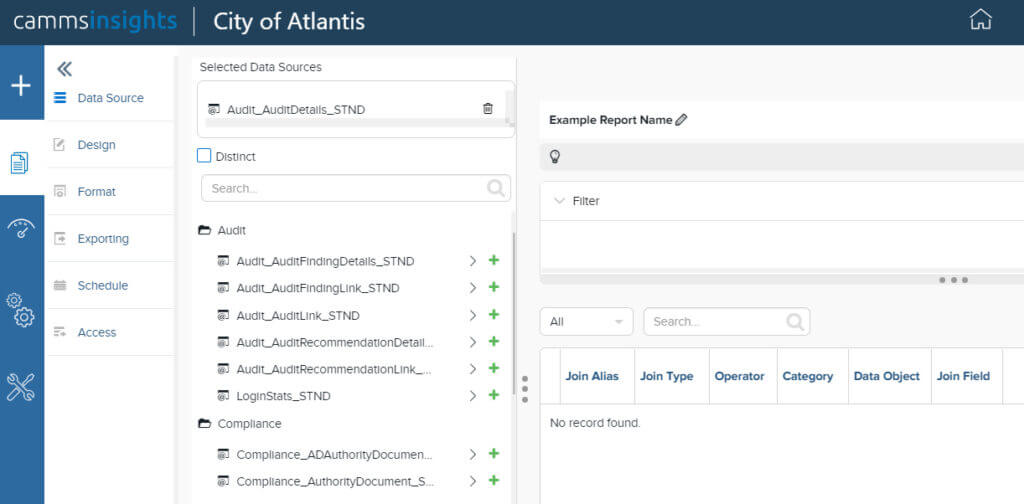
This is a convenient way to access the added data sources and also allows you to remove any unnecessary ones by clicking the trash icon.
2. You Can Now View Selected Data Sources in Its Own Section
Earlier, when defining conditional formatting, you could only add a colour to the cell or font, for the data column in question.
However, you now have access to a consolidated Conditional Formatting area under Report Part Properties, where you can assign the formatting to a cell, multiple cells or even the entire row, based on your condition.
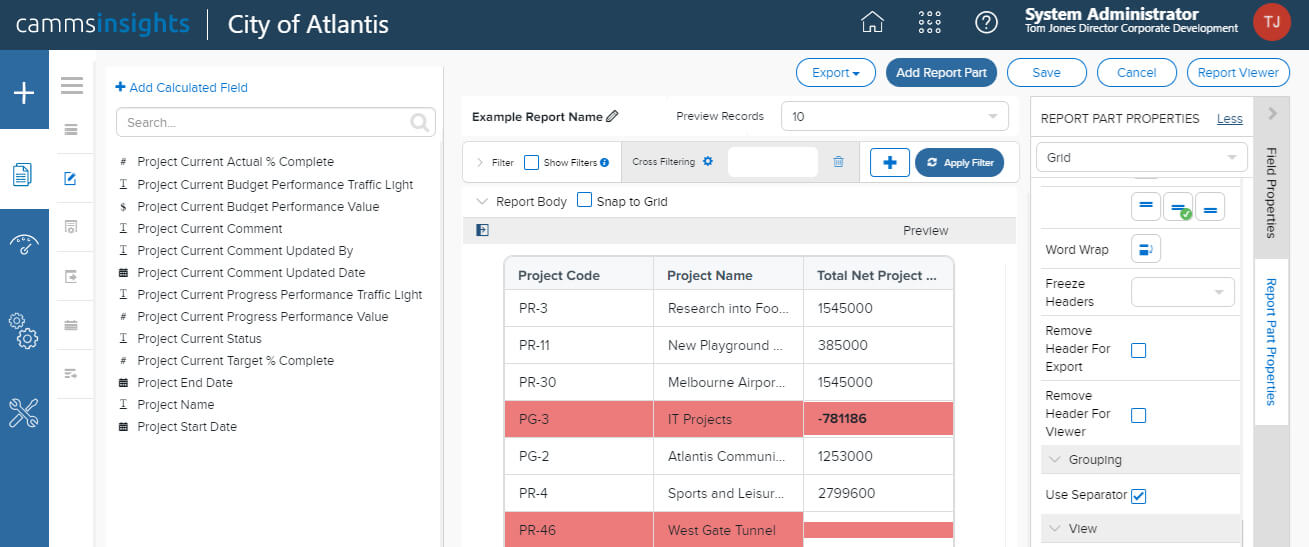
In addition to background colour, you can also apply different formatting to the text. Changing font size, font color, font type (E.g. Arial, Calibri etc.) and style (Bold, Italic etc.) will also allow you to customise the formatting according to what you prefer.
3. Default User Roles to Speed Up Role Configuration
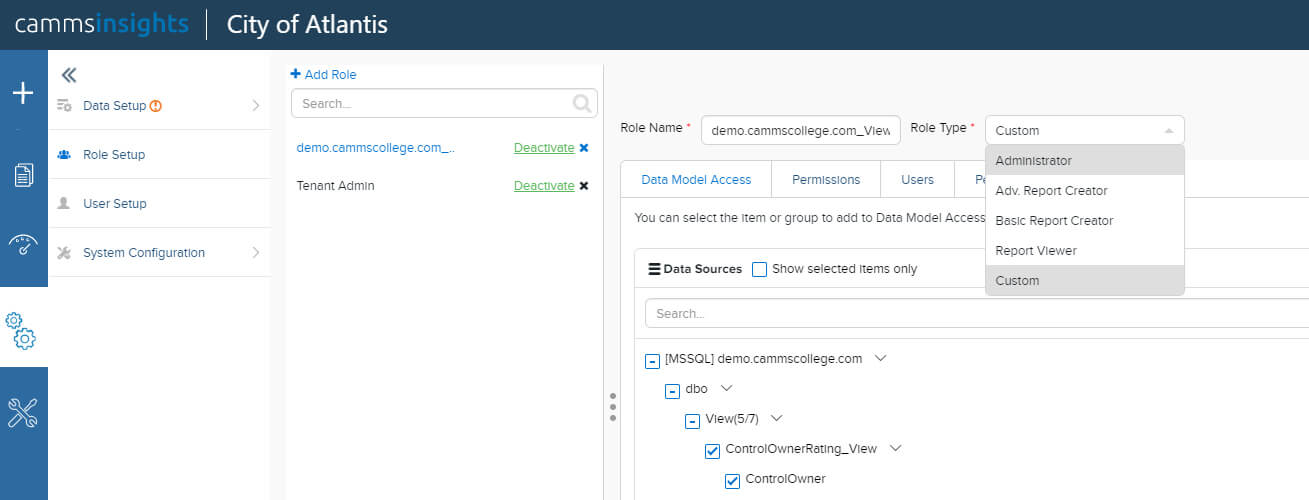
In the Administration area, when attempting to set up a new role, you can now choose from predefined types, which have a set combination of user permissions and privileges. For organisations that don’t want to go to the extent of defining a combination of permissions from scratch, this option lets you conveniently assign someone as a Basic Report Writer, for example.
4. Create Self-Service Datasets for Camms.Project Custom Tables, and Draw Data Automatically from the Current or Latest Phase
Moving on to our data sets, you now have the freedom to create your own dataset for custom tables, but, specify that it should only draw data from the current or latest phase of the project, making it truly dynamic. Previously, you had to specifically filter your custom table data for a particular phase, to ensure that it doesn’t repeat data across phases – this would have happened for objects which you had existing across more than one phase.

Keep in mind that once you have done this for all of your custom table datasets, you will have to perform a dataset update to bring them over to Camm.Insights.
You can refer our support article on updating datasets here in the Camms.Insights User Guide
5. Create Self-Service Datasets for Each of Your Custom Hierarchies
Similarly, you can now create a dataset for each custom hierarchy you have configured in the system, within Camms.Strategy as well. In the Hierarchy Configuration page as shown below you will see a button against each hierarchy to create the dataset.

Remember, just as before, once this button is clicked and its successfully updated, make sure to perform a Dataset update, to start using it within Camms.Insights.
What's New with Camms.Engage
1. New Tree Navigation Panel
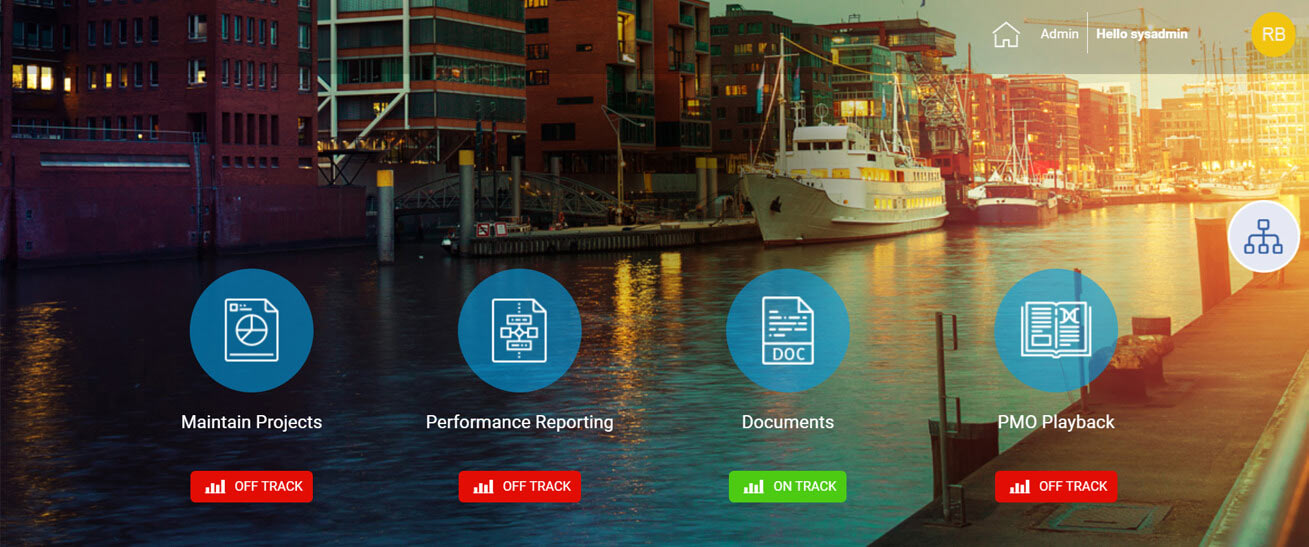
The Tree navigation panel is a recent feature that allows your visitors to click and navigate directly to a specific area of the dashboard with ease.
It enables a navigation panel on the frontend of the dashboard, displaying all the pages and components configured for that dashboard, in a hierarchical way.
To configure this, just navigate to the Admin area and click on the Edit panel of the required dashboard. Then, tick the Enable Tree Navigation checkbox, which will enable the feature.
2. New Action Task List Component
The new Action Task List component is a brand spanking new component, capable of displaying all the tasks which are linked to a hierarchy node or an Action in a grid view, similar to the existing Action List component.
3. Automatically Display All Projects Which Are Linked to The Hierarchy
This feature will come in handy when the Administrator prefers to show all projects which are linked to a hierarchy, without manual configuration. This means that all the projects which are linked to the hierarchy, subsequent to activating this, would be displayed on the front end of the dashboard automatically.
4. View KPI Performance Data within Top Level Dashboard Navigation Icons
In the May (2020) sprints we introduced viewing KPI performance data within the top level of the dashboard.
With this new feature, now you can directly view the performance summary of KPIs within dashboard’s page level, but remember, this will consider only the KPIs which are directly linked to the first level nodes. The main advantage of this feature is that it allows you to see each page’s / top level node’s performance at a glance, without the need of clicking into each relevant section.


